Nepal has more agricultural land than it has water on that land. About 44.63 per cent of cultivable land had irrigation access as of mid March 2026, on a base of 3.557 million hectares, according to the Ministry of Energy, Water Resources and Irrigation. Solar water pumping closes part of that gap without waiting for a canal. This guide covers both forms it takes here, the tube well pump in the Terai and the community lift scheme in the hills, how each is sized, what they cost, what the subsidy actually delivers, and the cases where I would tell a client not to build one.
Why irrigation is the constraint, not the crop
Most of the productivity discussion in Nepali agriculture is about seed, fertiliser and market access. Water comes first. A farmer with reliable dry season water can move from one paddy crop to paddy plus a winter vegetable cycle, and that single change is usually worth more than any input upgrade.
The land data explains why pumping exists at all. Canal irrigation depends on gravity from a nearby surface source, and in the hills and mountains that geometry mostly does not work.
| Region | Agricultural land (ha) | Irrigable by gravity canal (ha) | Share |
|---|---|---|---|
| Mountain | 227,000 | 60,000 | 26% |
| Hill | 1,054,000 | 369,000 | 35% |
| Terai | 1,360,000 | 1,338,000 | 98% |
| Total | 2,641,000 | 1,766,000 | 67% |
Source: Department of Irrigation figures reproduced in Karki and Lohani, Kathmandu University Journal of Science, Engineering and Technology, 14(2), 2020.
Two thirds of Nepal’s farmland could in principle be reached by canal. The other third cannot, and that is where pumping is not a preference but the only option. Even inside the Terai, where 98 per cent of land is canal irrigable in theory, the canals that exist run dry when the crops need them most.
There’s a photograph in the Karki and Lohani paper that makes the point better than any statistic. It shows an irrigation canal at Telkuwa in Bara district, taken in August, at the peak of the monsoon. The water in it is already low. If that is August, the dry season position is not a matter of degree.
Two different systems share one name
“Solar irrigation” in Nepal covers two engineering problems that have almost nothing in common beyond the panels. Conflating them is the most common mistake I see in proposals, and it produces designs that are wrong in both directions.
| Terai tube well pump | Hill lift irrigation scheme | |
|---|---|---|
| Source | Shallow or deep borewell | Spring, stream or river |
| Typical head | 10 to 50 m | 100 to 130 m |
| Command area | Under 2 ha, often one plot | 4 to 8 ha, tens of households |
| Ownership | One farmer | Water user group |
| Array | 1 to 5 kWp | 7 to 12 kWp |
| Water storage | Often none | Two reservoirs, upper and lower |
| Distribution | Field channel at the wellhead | Buried pipe network, valve chambers |
| Cost driver | The PV modules | The civil works |
| Subsidy route | AEPC demand driven application | Usually donor or local government funded |
The Terai case is what most published research measures, because that is where the pumps are. The hill case is what most of the remaining unirrigated land needs, and it is engineered like a small water supply scheme with a pump in the middle rather than like a solar installation with a hose on the end.
Everything below applies to both unless I say otherwise.
What a solar pumping system actually is
Sunlight becomes electricity, electricity drives a motor and pump, and the pump lifts water from a source to a field or a tank. There is no battery in a well designed irrigation system. Water in a tank is a cheaper and longer lasting way to store energy than a lead acid bank, and it does not degrade at eight per cent a year.
| Component | What it does | Where it goes wrong |
|---|---|---|
| PV array | Generates DC power | Soiling, shading from a tree planted after commissioning, mismatched strings |
| Pump controller | Conditions power, tracks maximum power point, starts the motor | Undersized for inrush; start up voltage too high for winter mornings |
| Motor and pump set | Converts electrical energy to hydraulic energy | Selected on nameplate rather than on efficiency at the duty point |
| Riser and delivery pipe | Carries water from source to discharge | Undersized diameter, so friction eats head the array paid for |
| Intake and collection tank | Buffers a slow source against a fast pump | Left out of the budget, so the pump runs dry |
| Distribution reservoir | Holds a day’s water at the high point for gravity release | Sited below a corner of the command area, which then never gets water |
| Mounting structure | Holds the array at tilt | Thin galvanising, no cleaning access, no allowance for row spacing on a terrace |
The controller deserves more attention than it usually gets. Its start up voltage decides whether the array’s output on a hazy Magh morning is enough to begin pumping, or whether the system sits idle until eleven o’clock. Ask for that number when you compare controllers, because it varies from about 200 to 300 volts across the units sold here and it changes the useful day length in winter.
Surface, submersible or floating
Three configurations cover almost everything installed in Nepal.
| Type | Typical use | Practical limit |
|---|---|---|
| Surface mounted | Canals, ponds, shallow open wells | Suction lift of roughly 3 to 6 m, and it loses prime |
| Submersible | Tube wells, deep bore, casing wells beside a collection tank | Needs full submergence at all times |
| Floating | Ponds, rivers with a varying level | Follows the surface, but exposed and easier to damage |
The suction limit is where most specification errors start. A surface pump cannot pull water up more than about six metres in practice, whatever the catalogue says, because atmospheric pressure sets the ceiling and cavitation sets in well before it. If the water table drops below that in Chaitra, the system stops working in exactly the month it is needed.
Select the pump on efficiency at your duty point, not on its rating. Across the three phase submersibles commonly available here in the 5 to 10 HP range, quoted efficiency at duty spreads from about 58 to 70 per cent for the same nominal kilowatt rating. That spread is twelve percentage points of array cost, and it is free to check before you buy. Several distributors will not give the figure at all, which is itself information.
On motors, my position is straightforward. DC motors draw perhaps a third to a half less energy than AC equivalents, which sounds decisive until you consider that they cost more and that brush and commutator maintenance on a submersible means pulling the pump out of the well. Above roughly 3 kW I would not specify DC. Induction motors dominate submersible work for good reasons: cheaper, less attention, and able to run on grid power on a cloudy day if a connection exists.
How sizing works, in the right order
The calculation runs backwards from water demand. It does not run forwards from how many panels the budget will buy, which is how a surprising number of installed systems appear to have been specified.
Step one: water demand
There are two ways in, depending on the crop.
For a single dominant cereal, use crop water requirement over the base period.
| Crop | Water requirement (cm) | Base period (days) |
|---|---|---|
| Paddy | 90 | 120 |
| Sunflower | 90 | 100 |
| Maize | 50 | 130 |
| Potato | 50 | 150 |
| Pulses | 50 | 120 |
| Wheat | 45 | 130 |
| Mustard | 35 | 125 |
| Radish | 30 | 60 |
| Cabbage | 30 | 120 |
Source: Department of Irrigation handbook figures, as tabulated by Karki and Lohani (2020).
Paddy at 90 cm over one hectare is 9,000 cubic metres across the base period, or 75 cubic metres a day.
For a year round vegetable rotation, which is what most hill schemes are actually built for, a continuous rate is more useful than a base period. I design to a net irrigation water requirement of about 0.18 litres per second per acre, which is 0.45 litres per second per hectare. Add distribution losses of around 25 per cent for a piped network with field channels at the end, and the figure to size against becomes 0.24 litres per second per acre, or 0.6 per hectare.
Note that this is a forward looking number. Land currently under maize and pulses demands far less. If you size on today’s cropping pattern you will build a system that constrains the diversification the project was justified on.
Step two: total dynamic head
Total dynamic head is not the depth to water. Build it up as a sum and write down each term, because reviewers can then check it and you can defend it two years later.
Vertical rise, intake to highest delivery point   100 m
Water depth in the intake or well                   3 m
Height of the distribution tank                     2 m
Friction loss along the transmission main           5 m
                                          Total   110 m   (design value)
Round up to the next sensible design figure and note that you have done so. Underestimating head is the classic failure. A system sized for 20 m that actually operates at 32 m will not deliver 60 per cent of design flow; it will deliver considerably less, because the pump is also pushed off its best efficiency point.
Drawdown during pumping is the term people forget, and it is not knowable without a pumping test on the actual well.
Step three: hydraulic energy and pump capacity
Hydraulic energy is the useful work of lifting the water: density times gravity times daily volume times head, divided by the efficiency of the machinery that does it.
E_h = (ρ × g × V × TDH) / (η_mp × η_i × 3.6 × 10⁶)   [kWh/day]

P_mp = (9.81 × TDH × Q) / η_mp   [kW, with Q in m³/s]
Use the manufacturer’s efficiency at your duty point for η_mp. Where you cannot get it, 60 to 65 per cent is a defensible working figure for a three phase submersible in this size range. The pump ratings in the Karki and Lohani worked case imply about 50 per cent, which is conservative and fine for a first pass. Assume 70 per cent because a datasheet headline says so and the array will be a third too small.
Step four: array sizing
Array power is hydraulic energy divided by the product of daily irradiation, a mismatch factor and a temperature derating factor. Standard values are 0.8 for mismatch, 0.8 for temperature in warm climates and 0.9 in cool ones. The Terai and the hills genuinely differ here, and using one number for both is lazy.
Peak sun hours is where published work and field practice part company. Studies that assume six peak sun hours are assuming single axis tracking. Almost no irrigation system in Nepal is tracked. For a fixed tilt array at 30 degrees facing south, I design off grid schemes to an equivalent of four peak sun hours, which is the figure that survives a winter month rather than an annual average.
That has a visible consequence in the finished specification. Stack the textbook derating chain at six peak sun hours and you arrive at roughly 1.8 kWp of array per kW of pump rating. Real off grid schemes here are commonly built at 1.3 to 1.4 kWp per kW. The difference is not carelessness: the pump rarely draws its full rated power, the controller’s maximum power point tracking recovers part of the loss, and the designer has accepted reduced flow on poor days because a storage tank absorbs it. If you cannot accept reduced flow, size closer to the textbook number.
Step five: controller
Size the controller to the pump rating, then check three things against the array: maximum DC input voltage against array open circuit voltage at the coldest expected temperature, maximum power point voltage range against array operating voltage, and start up voltage against what the array produces at nine in the morning in Poush.
An induction motor draws several times its running current for the first second or two of starting. Overrate for that by 20 to 25 per cent, or the pump simply will not start.
Worked example one: a hectare of paddy on a tube well
Taking 75 cubic metres per day over an assumed six peak sun hours, so 12.5 cubic metres per hour.
| At 10 m head | At 30 m head | |
|---|---|---|
| Pump capacity | 0.68 kW | 2.04 kW |
| PV array | 1.27 kWp | 3.81 kWp |
| Inverter | 1.28 kVA | 3.84 kVA |
| Array footprint | approx. 6.4 m² | 19.1 m² |
Source: Karki and Lohani (2020), Bara district case.
Tripling the head triples everything. Cost in a solar pumping scheme is set by depth to water, not by the area of the field.
Substitute a realistic fixed tilt figure of 4.7 kWh per square metre per day for the assumed six, and the 30 m array grows from 3.81 to about 4.9 kWp, an increase of 28 per cent. If a supplier quotes a 3.8 kWp array for a hectare of paddy at 30 m, ask what irradiation figure they used.
Worked example two: a hill lift scheme
Now the other case. Say four acres of year round vegetables, 110 m total dynamic head, and a spring giving half a litre per second.
Demand at 0.24 litres per second per acre is 0.96 litres per second, near enough 83 cubic metres a day. The spring yields 43 cubic metres a day. That gap is the whole design problem, and no amount of array fixes it.
What you can do is pump the water that exists, at a flow the pipe and pump handle efficiently, and share it out over time. Pumping 10 cubic metres an hour for four hours moves 40 cubic metres a day, which the spring almost exactly replaces overnight.
| Parameter | Value |
|---|---|
| Design flow | 10 m³/hr |
| Total dynamic head | 110 m |
| Hydraulic power | 3.0 kW |
| Pump shaft power at 65% duty efficiency | 4.6 kW, so a 5.5 kW (7.5 HP) unit |
| Array at 1.35 kWp per kW | approx. 7.4 kWp |
| Daily pumped volume | 40 m³ |
Four acres at 0.24 litres per second per acre needs about 83 cubic metres a day if watered together. At 40 cubic metres a day you cannot water it together, so you water half of it every second day. That is not a compromise forced by a small budget. It’s the correct answer for the source.
When the source is slower than the pump
This is the part of hill scheme design that has no equivalent in the Terai literature, and it is where most of the engineering judgement sits.
A spring delivers continuously and slowly. A solar pump delivers intermittently and fast, in a four hour window in the middle of the day. Bridge the two with a collection tank at the intake, sized so the level never falls to the pump inlet during the pumping window and refills before the next one.
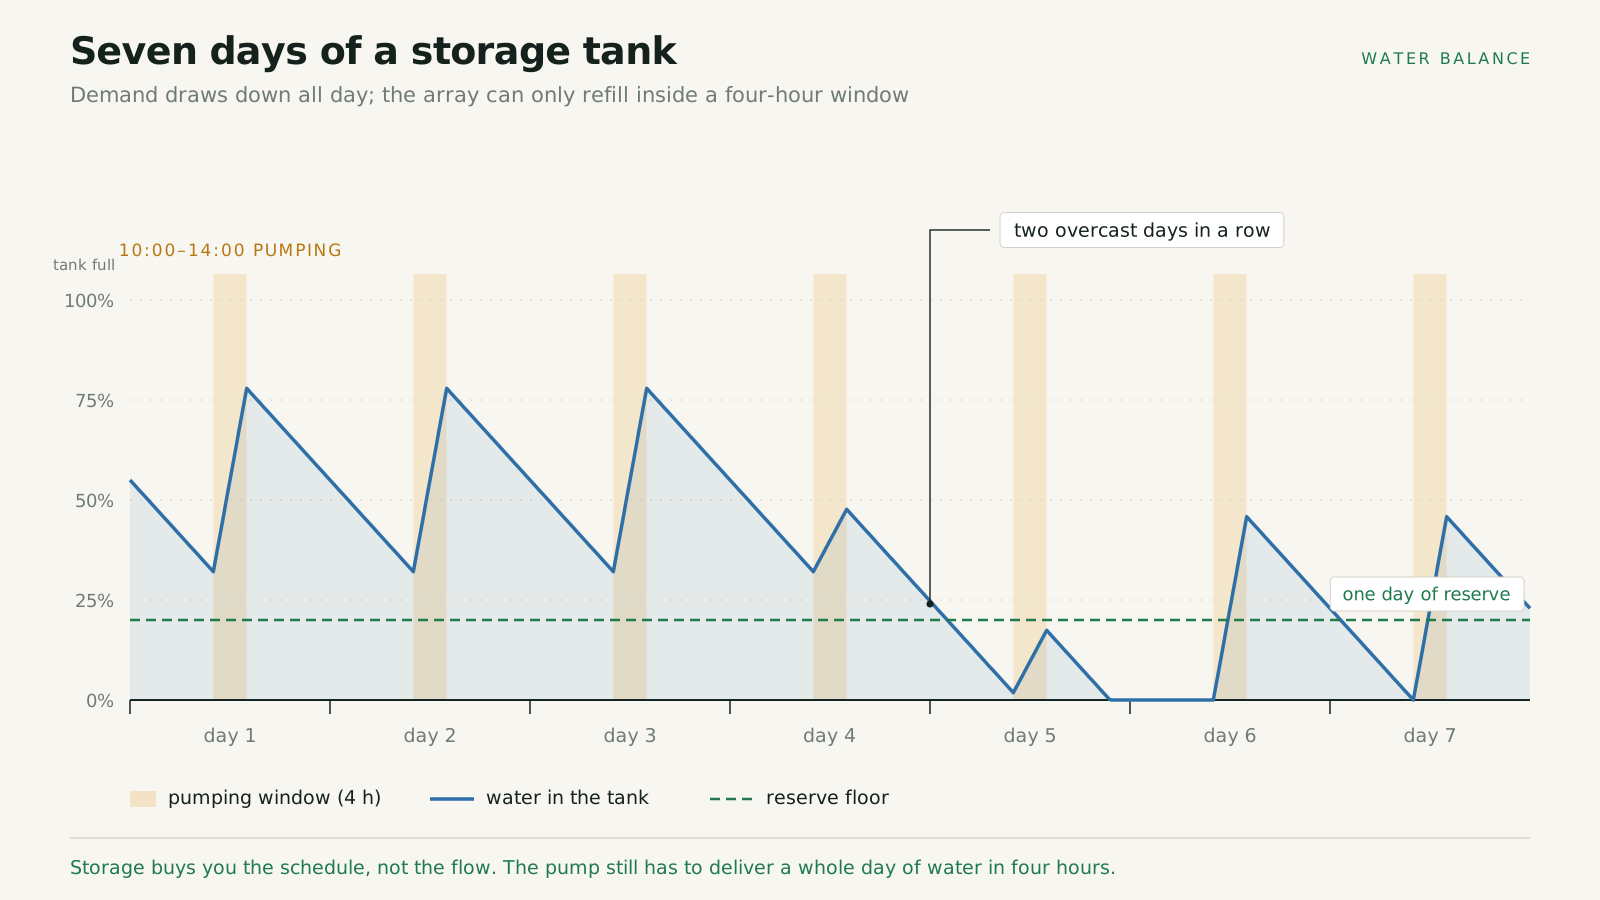
Run it as a water balance over a full seven day cycle rather than a single day, using the dry season measured flow. A tank of 50 to 75 cubic metres is typical for a scheme lifting 30 to 55 cubic metres a day, and it should still hold a working volume at the end of the pumping window rather than reaching zero.
Then divide the command area into zones and irrigate one zone per day on a five to seven day rotation, weighted by the effective area of each zone. Write that schedule into the feasibility report. A rotation that exists only in the engineer’s spreadsheet becomes, within one season, whoever opens the valve first.
Two honest limitations of this approach. Rotation depends on a functioning water user group, and the technical design cannot create one. And a single spring is a single point of failure, so identify a supplementary intake even if the community would rather not use the river.
Protection, and the parts that get value engineered out
These items are individually cheap and they are the first things struck from a quotation. Each one prevents a specific failure I would expect otherwise.
- Float switch or level probe at the intake for dry run protection. A submersible running on air burns out in minutes, and nobody is standing there watching.
- dV/dt filter between controller and pump where the cable run is long. Without it the voltage spikes off the drive degrade the motor winding.
- DC surge protection and a lightning air terminal with a down conductor. Hill sites on open ridges take strikes.
- Separate DC and AC earthing, copper rod with chemical earthing.
- Remote monitoring with an on board SD card, not cloud only. Mobile data in the hills is unreliable enough that a cloud only unit will lose the record you actually need.
- A spare pump in the bill of quantities. This can be a fifth of the electromechanical package and it is still the best value line in the document, for reasons the failure section below makes obvious.
Cable sizing convention worth adopting: design DC runs to a 3 per cent voltage drop and AC runs to 1 per cent. Bury the armoured AC cable to the pump at least 0.4 m where people and vehicles move. Specify hot dip galvanising on the mounting structure at a minimum of 85 microns and a design wind speed of 150 km/h.
What it costs
For a Terai tube well system, the published Bara case put one hectare at 30 m head at NPR 683,693, inclusive of components, installation, land for the array, and maintenance across the system life. At 3.81 kWp that is roughly NPR 179,000 per kWp. Those are 2020 prices.
| Field area (ha) | Pump (kW) | Array (kWp) | Total system cost (NPR, 2020) |
|---|---|---|---|
| 1 | 2.04 | 3.81 | 683,693 |
| 2 | 4.08 | 7.62 | 1,365,884 |
| 5 | 10.20 | 19.05 | 3,414,710 |
| 10 | 20.40 | 38.10 | 6,829,421 |
Source: Karki and Lohani (2020). Scaled linearly by the authors.
That linearity is a limitation of the study rather than a finding about the world. A 19 kWp system does not cost five times a 3.81 kWp system, because balance of system, installation and the pump all show some economy of scale. Treat the table as a shape, not a quotation.
For that class of system, modules dominate. The same study found PV panels above 60 per cent of total cost, with the land to mount them adding about a quarter of the panel cost again.
For a hill lift scheme the cost structure inverts, and this is the single most useful thing on this page for anyone budgeting one. The civil works, meaning intakes, two reinforced concrete reservoirs, a pump casing well, valve chambers, pipe support pillars, gabion protection, pipe supply and laying, and pipeline excavation, routinely come to around three quarters of capital cost. The entire electromechanical package is the other quarter.
The implication is uncomfortable for the way these projects are usually discussed. Falling module prices barely move the budget of a hill scheme. Reinforced concrete, steel reinforcement, and manual excavation on a 35 per cent gradient move it a great deal, and none of those are getting cheaper. If you want a hill lift scheme to cost less, shorten the transmission main or reduce the number of reservoirs. Arguing about panel brands is close to irrelevant.
AEPC maintains a benchmark price schedule for solar PV components, though the most recent edition I could confirm predates the current pricing cycle. The Bara case study’s NPR 179,000 per kWp remains the closest documented figure for a Terai tube well system, and it’s a reasonable planning anchor: module prices have generally softened since 2020, so it’s more likely to overstate today’s cost than understate it. Confirm against AEPC’s current benchmark schedule and a live supplier quotation before committing a budget.
Subsidy, and what it actually delivers
The Renewable Energy Subsidy Policy 2078 (2022) sets the current provisions, administered by the Alternative Energy Promotion Centre.
| Application | Subsidy provision |
|---|---|
| PV pumping for irrigation of agricultural land, co-funded by a community or private company | Up to 60 per cent, capped at NPR 2 million per system |
| Solar water pumping for drinking water, co-funded by local government or a user committee | Up to 90 per cent |
These figures match the policy’s own provisions, not just a secondary summary of them: AEPC’s published resources confirm the 60 per cent cap at NPR 2 million per system for agricultural PV pumping.
Note the cap. Two million rupees covers a meaningful share of a Terai tube well system and a small fraction of a hill lift scheme, which is why the hill schemes you see built are donor or local government financed rather than subsidy financed. The policy is shaped around the smaller system.
The gap between policy and outcome is the interesting part. Varshney and colleagues, publishing in Environmental Research Letters in March 2026, surveyed 630 farmer households and 404 pump owners. The official subsidy is 60 per cent. Actual average farmer contribution was 4 per cent, because local governments frequently topped up the federal share, and nearly half of smallholders in the sample received a pump at no cost. Average out of pocket payment came to NPR 25,741, only modestly more than a diesel pump.
That sounds like an unqualified success and it is not. A near free asset changes both the selection process and the relationship the owner has with the machine. The same research found borewell ownership strongly associated with receiving a pump, which is a sensible technical criterion and also a wealth filter, since a farmer who already has a tube well is not the poorest farmer in the ward. Earlier work found AEPC receives far more applications than it can approve, which forces a rationing process that no amount of good intent makes neutral.
Applications concentrate heavily. Koshi and Madhesh together account for around 61 per cent of AEPC installations.
Ownership, tariffs and who pays the operator
Three arrangements are in use, and the choice determines whether the system is still running in year eight.
Individual ownership. One farmer, one pump, one plot. Simplest to administer and easiest to get subsidised. It also produces the worst utilisation, because a system sized for one hectare of paddy sits idle most of the year once that hectare is watered.
Water user group ownership. Several dozen households share a scheme and a command area. This is the only workable model for a hill lift system, because no individual can fund or operate one. Better utilisation, harder governance.
Fee for service. An entrepreneur owns and maintains the system and sells metered water. Utilisation rises because the pump serves multiple plots, and unit water cost falls. Widespread in Bangladesh, still thin here, partly because average landholdings are small enough that an entrepreneur needs a lot of customers before the arithmetic works.
For any shared scheme the tariff question arrives immediately, and communities with no history of paying for water will not accept a complicated one. Three mechanisms, and what I think of each:
| Mechanism | Requires | Verdict |
|---|---|---|
| Flat rate per ropani per month | A list of households and their landholding | Workable. Simple bookkeeping, no metering, no disputes about measurement |
| Share of production | Weighing output before dispatch | Partly workable. Heavy record keeping, and households under reporting production will cause conflict |
| Volume consumed | A flowmeter on every distribution branch | Not workable in practice. The record keeping burden falls on volunteers and it stops happening by season two |
The number the tariff has to reach is smaller than people expect and larger than they will offer. A community scale scheme needs an operator, and an operator needs paying. Budget roughly NPR 60,000 a year for a part time operator’s salary and NPR 20,000 a year for routine maintenance, giving about NPR 80,000 annually. Spread across a scheme of eight to eleven acres, that lands near NPR 250 per ropani per month, or roughly NPR 2,000 per acre.
Here is the honest limitation, and it applies to nearly every community scheme document I have read. That tariff covers operation. It does not build a sinking fund for replacement. A submersible pump of this size is a substantial capital item and it will not last the life of the concrete. A tariff set to cover the operator and consumables leaves nothing behind at year ten, and the group is then back where it started, asking for a donor. If you are designing the tariff, price the pump replacement into it from the start even though it makes the first year harder to sell.
Where these systems fail
Utilisation is the whole story, and the numbers are not good. The 2026 Environmental Research Letters study found solar irrigation pumps in Nepal operating around 745 hours a year, well below technical potential. A system available four hours a day for even half the year would clock over 700, so that is close to a floor rather than a healthy figure.
Three findings from that work are worth acting on:
- Repairs take an average of 110 days. A pump that fails in Falgun is not fixed before the winter crop is lost. This is the argument for the spare pump in the bill of quantities.
- After sales service is frequently absent entirely.
- Operation and maintenance training raises utilisation by 38 per cent, which is a larger effect than almost any hardware change available at the same cost.
An earlier IWMI study reached a similar conclusion by another route: the average farmer operated the pump less than half the time it was in their possession, which made it less cost effective than the diesel pump it replaced.
The income case also tends to be presented more confidently than the underlying numbers support. Average vegetable yield in Nepal runs around 14.48 tonnes per hectare (Statistical Information on Nepalese Agriculture 2079/80). Roughly 20 per cent of production is lost to pests. Producers capture somewhere between 42 and 76 per cent of the market price depending on the vegetable and the chain. And only about a fifth of Nepali farmers are commercially oriented at all (GC and Hall, Agriculture, 10(5), 2020). Multiply those together and the household income improvement from irrigation alone, without market linkage and input support, is real but modest. Water is necessary and it is not sufficient.
Beyond that, the recurring technical failures I would look for are seasonal head variation that was never measured, a command area larger than the source can sustain in Chaitra, and a delivery pipe sized for capital cost rather than friction loss.
When solar is the wrong answer
If the grid is close, extend the grid.
Karki and Lohani ran this comparison properly, modelling feasible extension length in DIgSILENT PowerFactory against a five per cent voltage drop limit.
| Grid extension distance required | Solar wins up to |
|---|---|
| 1 km | 4 hectares |
| 1.5 km | 7 hectares |
| 2 km | 11 hectares |
Above those areas, grid extension plus an electric pump is cheaper. A solar system’s cost scales with the area irrigated while a line extension is a one time cost, so the larger the scheme the more a line makes sense.
As a current sense check on the cost side, a three phase extension in hill terrain is commonly budgeted in the order of USD 20,000 per kilometre, and around half that for a few hundred metres. Against a community scheme costing several times that, the line often looks attractive on paper. What defeats it in practice is reliability rather than price. Rural single phase supply here goes down in high wind and through the monsoon, unpredictably, and a scheme that must irrigate on a fixed rotation cannot depend on it. That is a legitimate reason to stay off grid, and it is a better reason than cost.
This matters more now than when the 2020 study was written. That work cited 2018 figures showing 17.66 per cent of local bodies entirely unelectrified. National electricity access is now reported at around 99 per cent. The set of genuinely off grid sites has shrunk, and any feasibility study that assumes off grid conditions without measuring the distance to the nearest three phase pole is doing the client a disservice.
The other case for saying no is a source that cannot sustain the abstraction. A pump can only lift what the aquifer or the spring will give. I have seen more schemes constrained by source yield than by anything on the electrical side, and no additional array capacity fixes it.
How I would sequence a feasibility study
Source measurement first, in the dry season, before anything else is specified. Use the bucket method on a spring and a pumping test on a well, and record the date, because a March flow and an August flow describe different projects.
Then head, measured, including drawdown. Then the command area and crop pattern, agreed with the people who will farm it rather than assumed from the land registry. Only then sizing, and only then a supplier conversation.
Alongside the engineering, start the clearances early, because they take longer than the design does:
- Written consent for private land under the array, the reservoirs and the pipe route
- Right of way for the transmission main
- Water abstraction agreement, including any existing drinking water use of the same source
- Electrical safety clearance before commissioning
- A water user group formed and functioning, not promised
The first three steps can kill a project, and they cost a fraction of what a wasted procurement does. The last one kills it more slowly and after the money has been spent.
For related work, see my solar PV feasibility study, technical due diligence and techno economic modelling pages.
Frequently asked questions
What size solar pump do I need for one hectare?
For paddy, which needs about 9,000 cubic metres per hectare over a 120 day base period, the published Bara case gives a 0.68 kW pump with a 1.27 kWp array at 10 m head, and 2.04 kW with 3.81 kWp at 30 m. Those assume six peak sun hours. On a fixed tilt array, add roughly 28 per cent to the array size.
What is the difference between a solar irrigation pump and a solar lift irrigation scheme?
A solar irrigation pump is usually one farmer, one borewell, a head of 10 to 50 m and an array of a few kilowatt peak. A lift irrigation scheme serves a community from a spring or stream, lifts water 100 m or more into a reservoir at the top of the command area, and distributes it by gravity through a piped network on a rotation. The second is mostly a civil works project.
How many peak sun hours should I design for in Nepal?
Four, for an off grid fixed tilt system that has to perform in winter. Six only applies with single axis tracking, which almost nothing here has. Designing to an annual average produces a system that underdelivers in exactly the dry months it was built for.
Do solar water pumps need batteries?
No, and adding them is usually a mistake. Store water in a tank instead. A tank costs less, lasts longer, needs no replacement at year seven, and buffers supply against demand just as effectively for irrigation.
How much does a solar irrigation system cost in Nepal?
For a Terai tube well system, the most recent published figure I would stand behind is NPR 683,693 for one hectare at 30 m head, from 2020, or about NPR 179,000 per kWp. Module prices have fallen since. A hill lift scheme serving a community is an order of magnitude higher and is dominated by civil works rather than by equipment.
What subsidy is available for solar irrigation in Nepal?
AEPC provides up to 60 per cent of system cost for agricultural pumping, capped at NPR 2 million per system, under the Renewable Energy Subsidy Policy 2078. Drinking water systems co-funded by local government can receive up to 90 per cent. In practice local government top ups have often pushed the farmer’s share far below 40 per cent.
Is a solar pump always cheaper than extending the grid?
No. Below about four hectares, solar beats a one kilometre grid extension. Above that the line wins, with the crossover moving out to seven hectares at 1.5 km and eleven at 2 km. Measure the distance to the nearest three phase pole before assuming off grid, then weigh the reliability of that supply separately from its cost.
Where to go next
If you are sizing a system, work the chain in order and write down the head build up term by term. If you are deciding whether a scheme is worth building at all, two measurements taken in the dry season will settle most of it before you price a single panel: what the source actually yields in March, and how far it is to the nearest three phase pole.