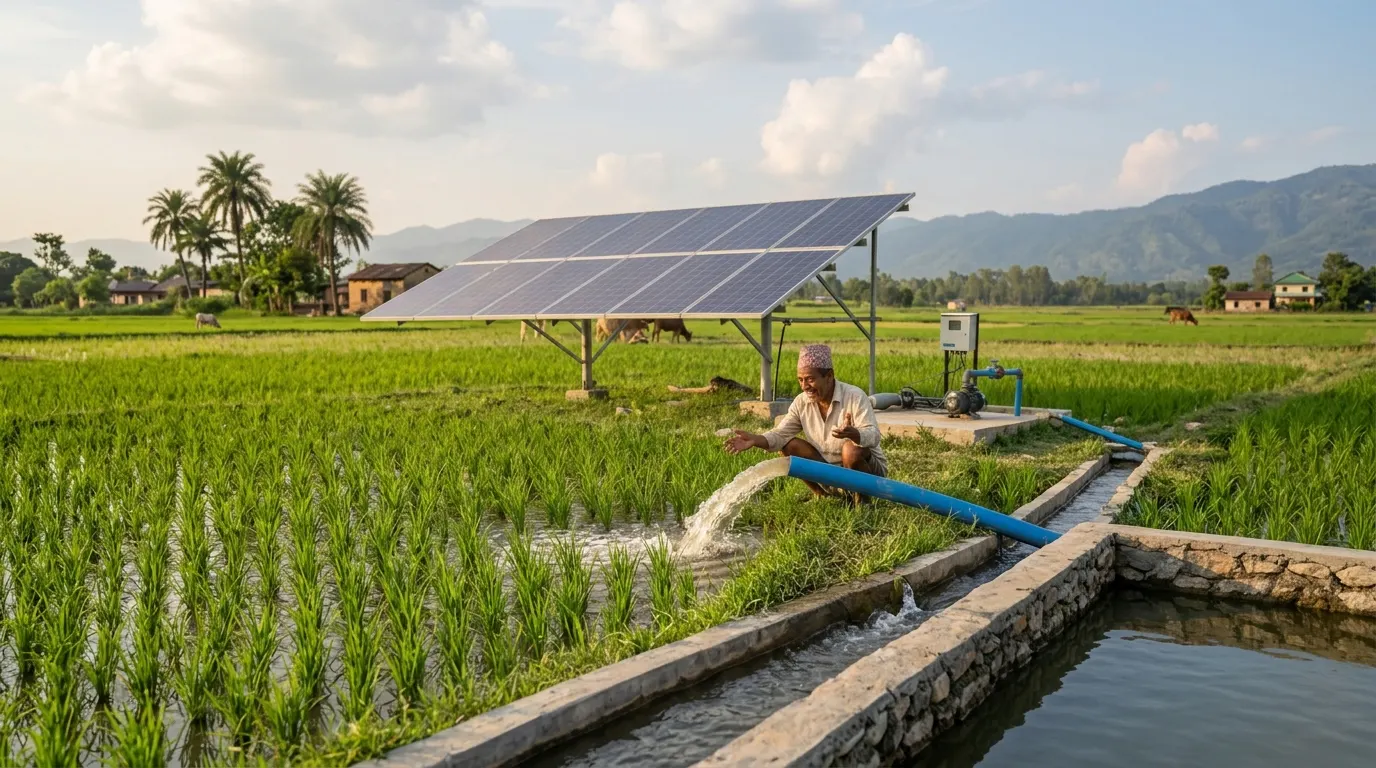
Undersize a solar pumping system and the crop fails in the month it was built for. Oversize it and the farmer paid for panels that spend most of the year doing nothing. Both mistakes come from the same habit: starting at the panels and working forwards. The calculation runs the other way, from water demand back through head, pump and array, and each step constrains the next. This post walks the full chain with the numbers, using the method set out in the ICIMOD technical handbook on solar water pumps.
Start with water demand, not with panels
Crop water requirement and base period
For a single dominant cereal, take the crop water requirement over its base period.
| Crop | Water requirement (cm) | Base period (days) |
|---|---|---|
| Paddy | 90 | 120 |
| Sunflower | 90 | 100 |
| Maize | 50 | 130 |
| Potato | 50 | 150 |
| Pulses | 50 | 120 |
| Wheat | 45 | 130 |
| Mustard | 35 | 125 |
| Radish | 30 | 60 |
| Cabbage | 30 | 120 |
Source: Department of Irrigation handbook figures, as tabulated by Karki and Lohani (2020).
Paddy at 90 cm over one hectare is 9,000 cubic metres across the season, or 75 cubic metres a day. Everything below follows from that one figure, so it’s worth getting right.
For a mixed cropping pattern, hand the problem to CROPWAT 8.0 with climate data from NASA POWER, which gives you a monthly irrigation water requirement in litres per second per hectare rather than a single seasonal total. That is a better basis for a real scheme, because it tells you something the seasonal total hides.
The month you size for
Monthly irrigation demand is not flat. It’s close to zero through the monsoon, rises through autumn, and peaks sharply in the dry months before the pre-monsoon rains. A typical mid-hill vegetable rotation might peak around 0.54 litres per second per hectare in Chaitra while averaging 0.16 across the year.
That ratio is the most consequential number in the whole design, and it’s usually skipped.
| Sizing basis | Design demand | Relative system size | What you get |
|---|---|---|---|
| Peak month | 0.54 l/s/ha | 3.4× | Full demand met by solar, every month |
| Annual average | 0.16 l/s/ha | 1.0× | Short in four or five months, including the ones that matter |
| Intermediate | 0.33 l/s/ha | 2.1× | Solar covers about ten months, grid or storage covers the rest |
Sizing to the peak month means buying a system three times larger than the average demand, which then idles for most of the year. Sizing to the average produces a system that fails precisely when the crop needs water.
Where there’s a grid connection, I’d size for an intermediate month and let the grid supplement the two or three peak months. Where there’s no grid, the honest options are a larger array or a smaller command area, and the second is usually the better answer.
Total dynamic head
Total dynamic head is vertical head plus major loss plus minor loss. Build it as an itemised sum so it can be checked later.
- Vertical head. Water surface to the highest delivery point. Measure it, with an Abney level or a total station, not from a contour map.
- Drawdown. How far the water level falls while pumping. Only a pumping test gives you this.
- Major loss. Friction along the pipe, from Darcy and Weisbach. The friction factor depends on Reynolds number, so it’s laminar formula below 2,000 and the Moody diagram above 4,000.
- Minor loss. Bends, unions, valves, the flow meter. Each fitting has a coefficient. A swing check valve is 2, a water meter is 7, a fully open globe valve is 10, which is why nobody puts a globe valve in a transmission main.
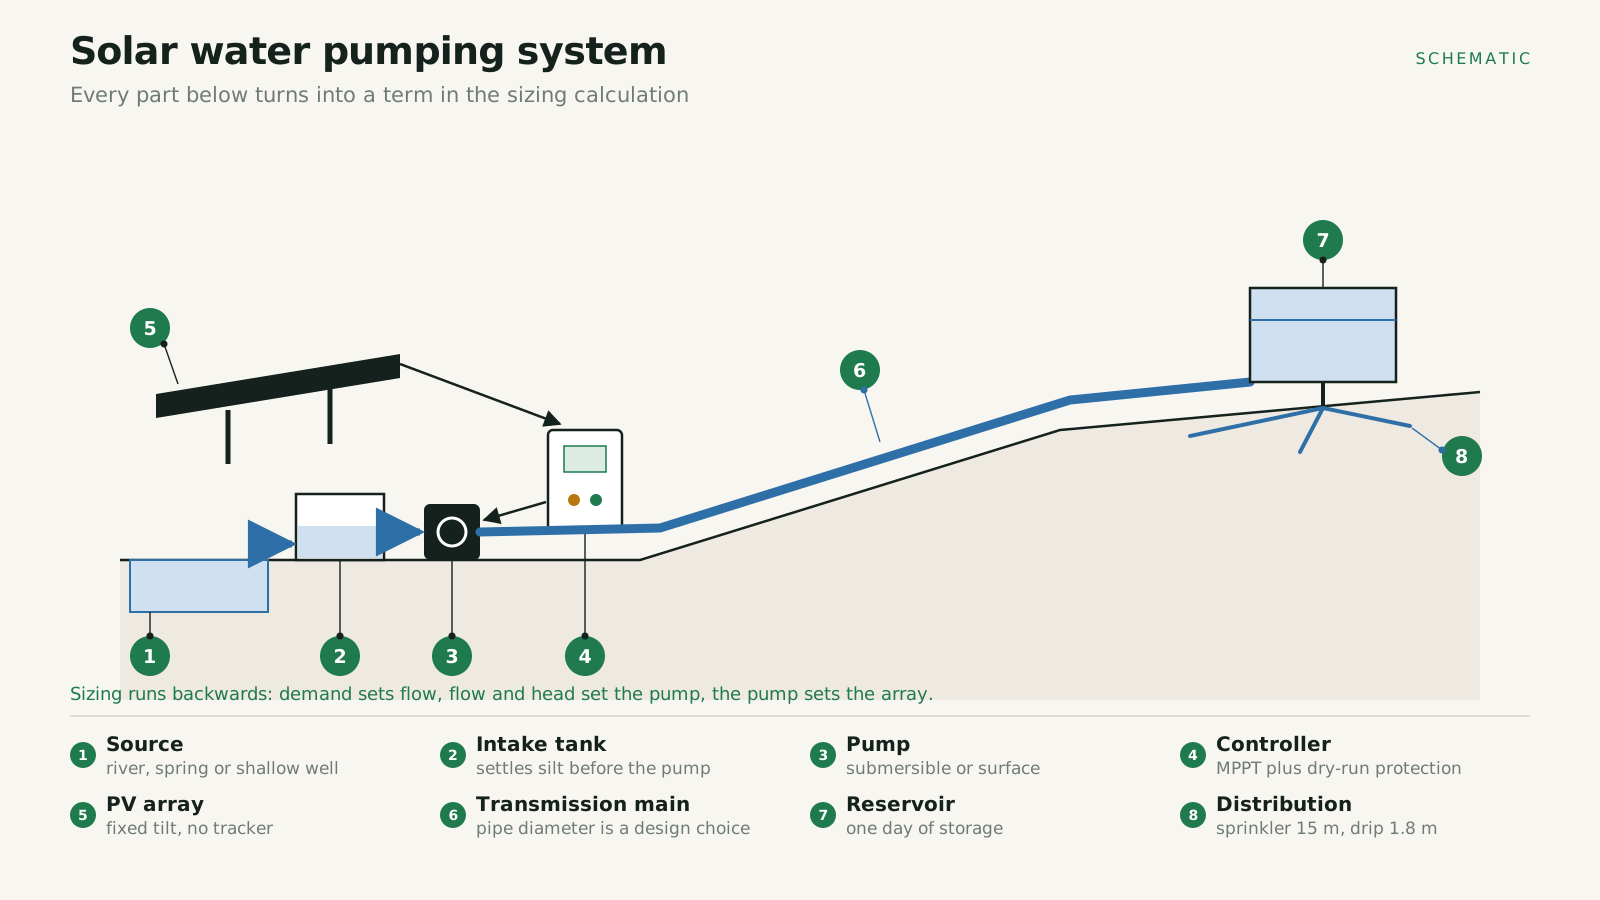
- Delivery pressure. Forgotten more often than anything else. A sprinkler kit needs about 15 metres of pressure head at the nozzle. Drip needs around 1.8 metres. If the scheme feeds sprinklers, that 15 metres is part of your TDH and the pump has to produce it.
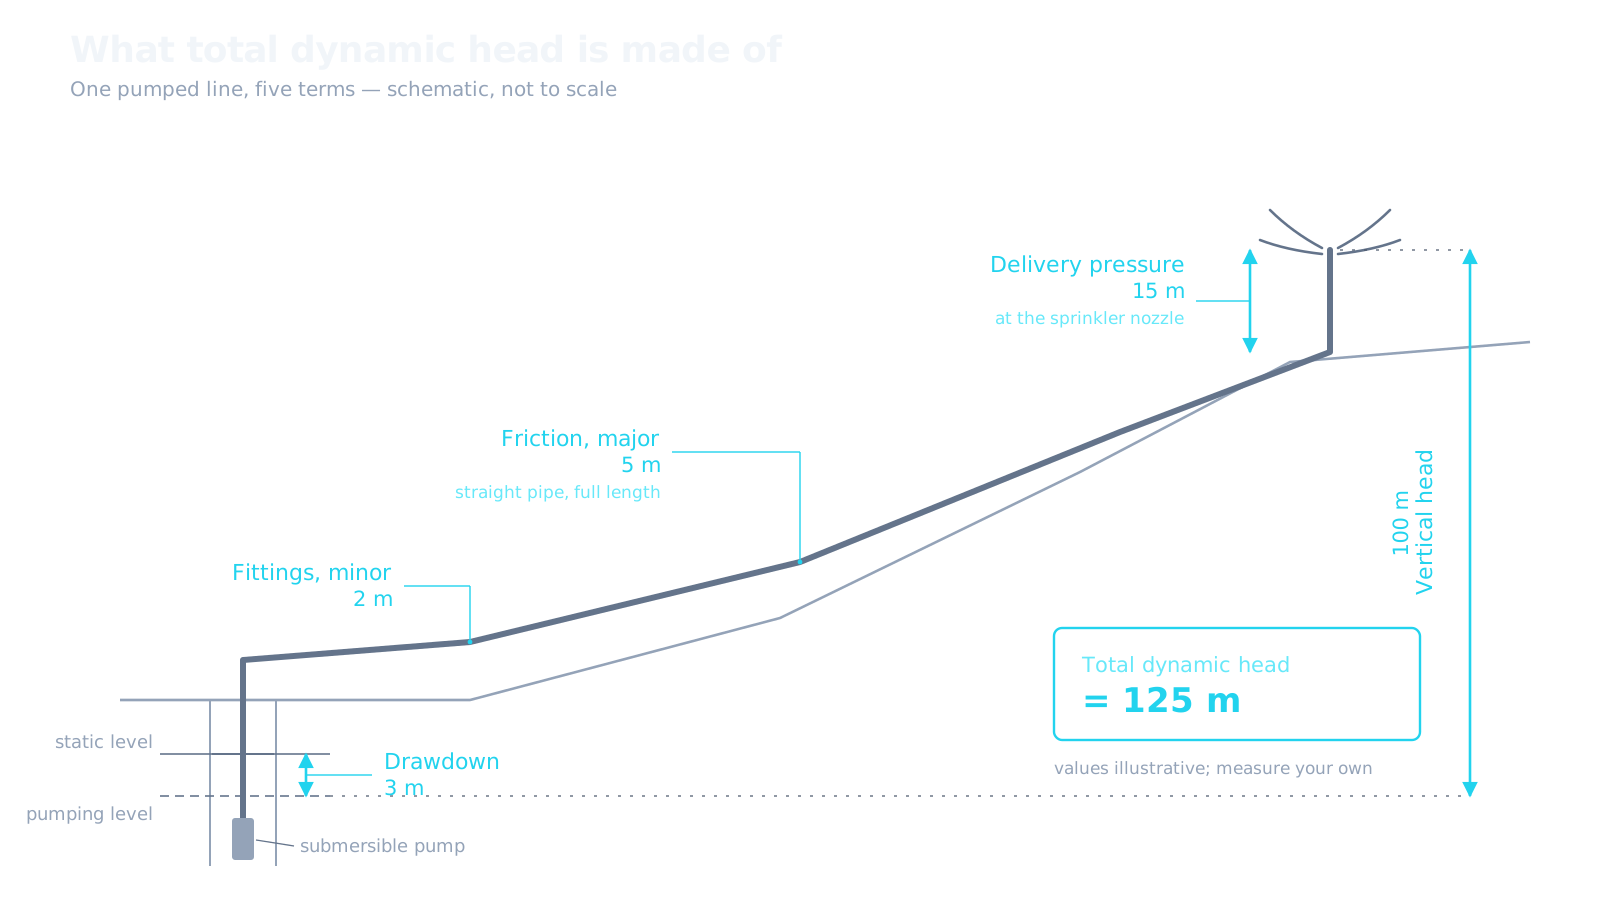
For a first pass before you know the fittings, estimating minor loss at roughly one per cent of the transmission pipe length is close enough to proceed, then refine it once the civil drawings exist.
A system sized for 20 metres that actually runs at 32 will not deliver 60 per cent of design flow. It’ll deliver considerably less, because the pump is also pushed off its best efficiency point.
Pipe diameter is a design variable, not a given
Here’s the step that separates a designed system from an assembled one. The instinct is to match the transmission pipe to the pump outlet. Do that and friction can dominate everything else.
The ICIMOD handbook works a case at 141 metres vertical head where iterating the pipe size gives this:
| Pipe (HDPE PN16) | Major loss | Minor loss | Resulting TDH |
|---|---|---|---|
| 40 mm | 33.66 m | 0.60 m | 175 m |
| 50 mm | 15.89 m | 0.35 m | 157 m |
| 63 mm | 2.47 m | 0.11 m | 144 m |
Going from 40 mm to 63 mm removes 31 metres of head. At the 40 mm size the chosen pump can’t meet the demand at all and you’d be shopping for a bigger one, with a bigger array behind it.
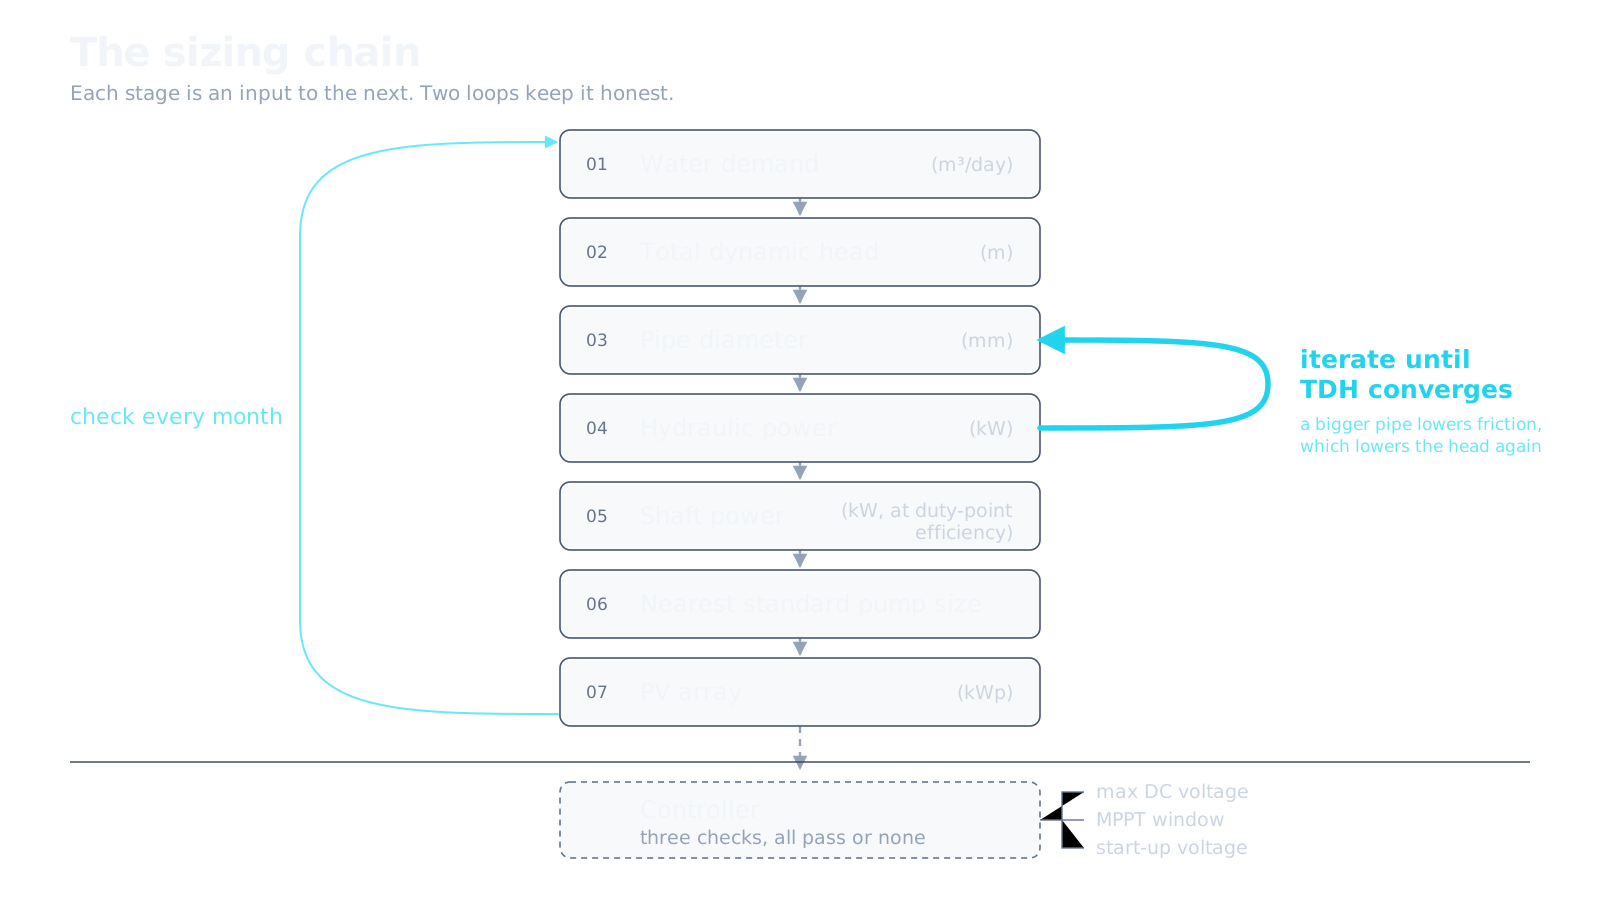
Pipe is cheap. Pumps and panels are not. One size up on the transmission main is almost always cheaper than one size up on the pump, and the saving compounds because the array shrinks with it. This is iterative: assume a loss, size the pump, calculate the actual loss, and go round again until the numbers converge.
Hydraulic energy and pump capacity
Hydraulic power is the useful work of lifting water: weight of water per unit time multiplied by the height it’s raised. In the form you’ll use it:
P_H = (ρ × g × q × h) / (3.6 × 10⁶)   [kW, with q in m³/hr and h in m]

P_S = P_H / η                          [kW shaft power]
The efficiency term is where careful designs come apart. Use the manufacturer’s efficiency at your duty point, read off the pump curve where your flow and head intersect, not the peak of the efficiency curve. A pump quoted at 69 per cent peak may sit at 50 per cent where you’re actually running it. Across three phase submersibles in the 5 to 10 HP range sold here, duty point efficiency spreads from roughly 58 to 70 per cent for the same nominal rating.
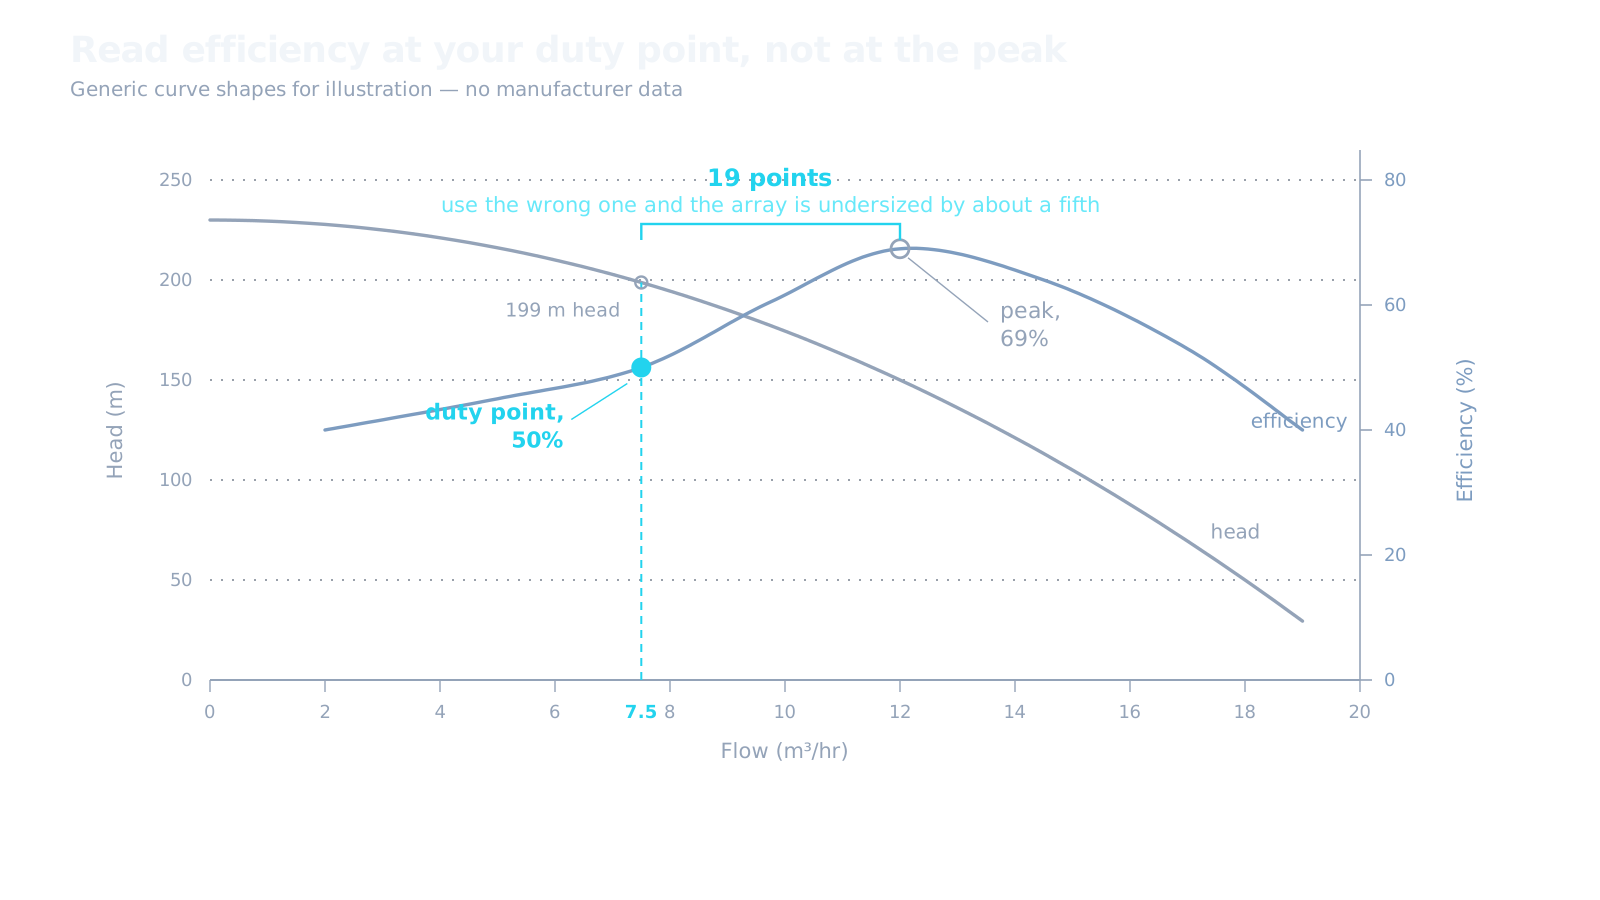
Where you can’t get the figure, 60 per cent is defensible for a first pass. Assume 70 because a datasheet headline says so and the array comes out a third too small.
Round the shaft power up to the nearest standard motor size. Pumps come in 1.1, 1.5, 2.2, 3, 4, 5.5 and 7.5 kW, and nothing in between.
Sizing the PV array
Peak sun hours
Daily global horizontal irradiation in kWh per square metre per day is numerically the same as peak sun hours, because it’s the accumulated energy expressed as equivalent hours at 1,000 W/m². Convenient, and the source of a persistent error.
Use the minimum monthly average, not the annual one. A system that meets demand in Baisakh and fails in Poush has not been designed, it’s been averaged. Then apply the uncertainty margin on the irradiation dataset itself, which for most sources is around ten per cent.
For a fixed tilt array at 30 degrees facing south, I design off grid schemes in Nepal to four peak sun hours. Six only applies with single axis tracking, which almost nothing here has.
The loss stack
| Loss | Typical value |
|---|---|
| DC wiring | 3% (BS 7671 limit) |
| AC wiring | 1% (BS 7671 limit) |
| Shading | 10% at a clean site, far more where trees or terrain intervene |
| Soiling | 2% |
| Controller | 2% |
| Temperature | Around −0.39% per °C above 25 |
Temperature is where the Terai and the hills genuinely part company. A site running 6 °C above the rated 25 loses about 2.5 per cent. A Terai site in Jestha loses considerably more. Using one derating figure for both regions is lazy.
Two routes to the same answer
Stack those losses for a 3 kW pump and the combined efficiency comes to about 0.81, so the array needs to be 3.71 kWp. That’s a ratio of 1.24 to the pump rating.
The handbook’s preliminary rule of thumb is to multiply the pump size by 1.3. Real off grid schemes I’ve seen specified in Nepal land at 1.3 to 1.4 kWp per kW of pump rating.
Three independent routes converging on the same number is a good sign. Use 1.3 for the preliminary estimate that decides whether the project is worth pursuing, then build the loss stack properly for the detailed design and let the site conditions move it.
The controller, and three checks people skip
Size the controller to the pump rating, then check the array against it:
- Maximum DC input voltage against array open circuit voltage at the coldest expected temperature. Voc rises as temperature falls, and a winter morning is when you’d exceed it.
- Maximum power point voltage range against array operating voltage. Design the array voltage toward the upper end of the MPPT window. If the window is 250 to 550 V, an array sitting at 420 V leaves 170 V of headroom below the operating point, which is what keeps the system pumping through cloud and early morning rather than dropping out.
- Start up voltage. This ranges from about 200 to 300 V across units sold here, and it decides whether pumping begins at nine or at eleven on a hazy Magh morning. Ask for the number.
On inrush: an induction motor given full voltage at start draws two to three times its rated current. Without a soft start function you’d have to oversize both array and controller just to supply that surge, which makes the whole system inefficient in normal running. Soft start ramps the voltage instead. Where it isn’t available, overrate the controller by 20 to 25 per cent.
Worked example: one hectare of paddy
Nine thousand cubic metres over a 120 day base period, at four peak sun hours, no tracking.
| 10 m TDH | 30 m TDH | |
|---|---|---|
| Daily volume | 75 m³ | 75 m³ |
| Design flow | 18.75 m³/hr | 18.75 m³/hr |
| Hydraulic power | 0.51 kW | 1.53 kW |
| Shaft power at 60% | 0.85 kW | 2.55 kW |
| Nearest standard pump | 1.1 kW (1.5 HP) | 3 kW (4 HP) |
| Array at 1.3× | 1.4 kWp | 3.9 kWp |
Two things fall out of that table.
Tripling the head triples the system. Depth to water, not field area, is what sets the cost of a solar pumping scheme.
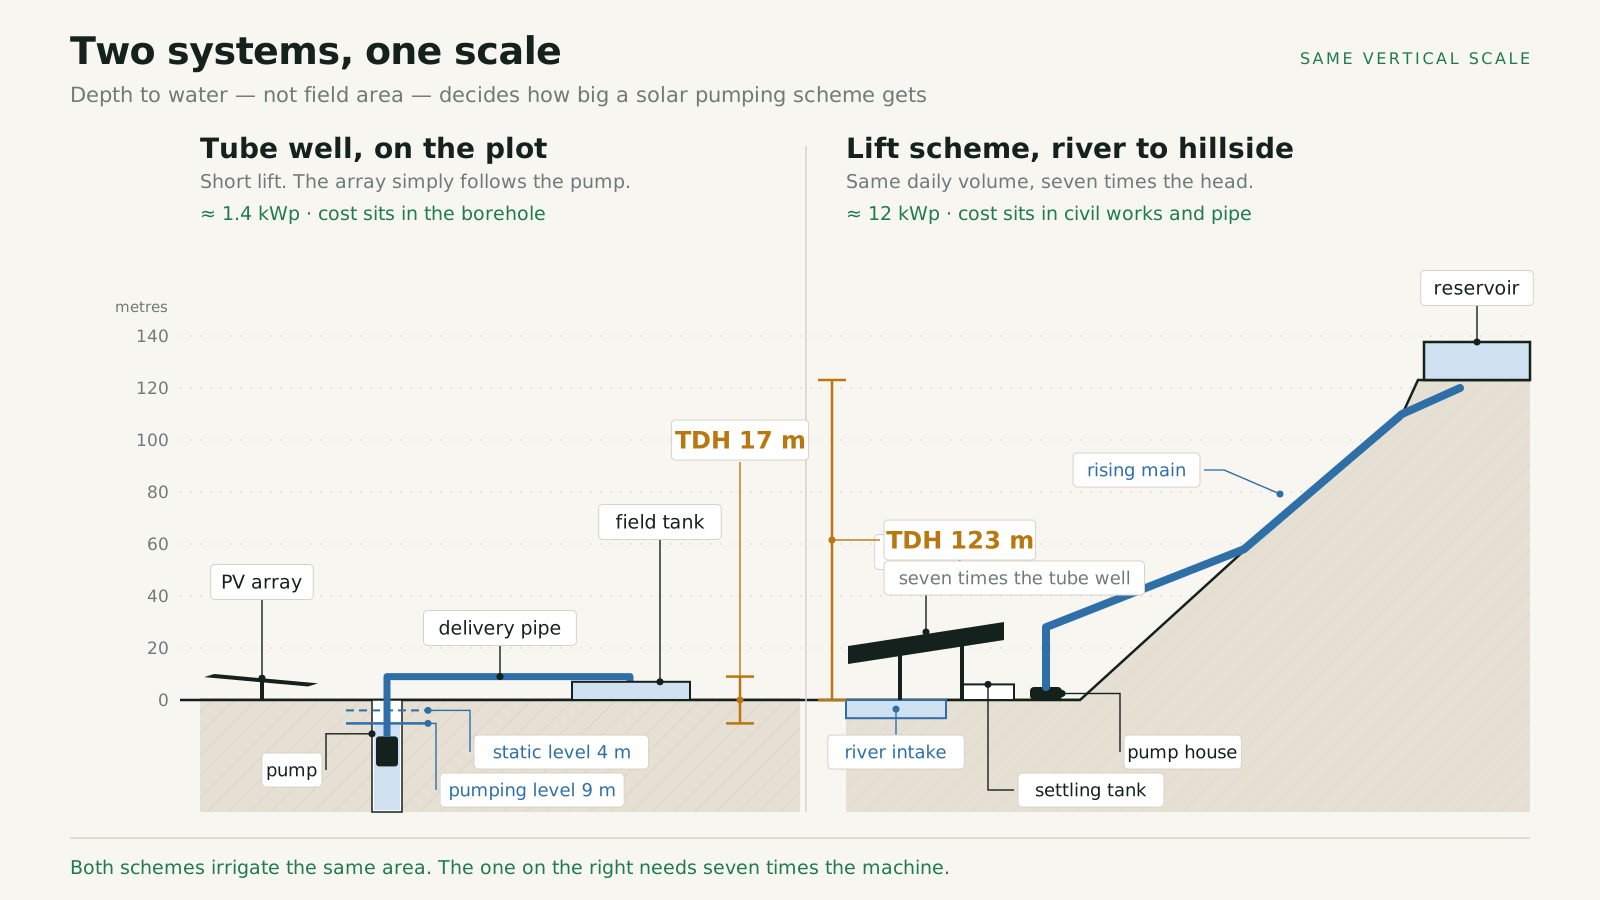
That’s the same relationship at a scale most farm-level sizing never encounters. A tube well pump on the plot and a hill lift scheme moving the same daily volume can differ by a factor of seven in head, and the array follows almost exactly.
And 18.75 cubic metres an hour is a serious flow for one hectare. Paddy is a thirsty crop compressed into a four hour pumping window, which is a large part of why solar pumping in Nepal mostly serves vegetables rather than rice. A storage tank helps you irrigate on your own schedule; it does not reduce the flow the pump has to produce, because the solar window is the solar window.
Then check every month
Sizing produces one number. Verify it across twelve.
Multiply each month’s average peak sun hours by the pump’s output and plot it against that month’s demand. You’ll usually find a shortfall in a few winter months. The decision then is whether to go up a pump size or accept the shortfall, and accepting it is often correct: a 15 per cent drop in December on a drinking water scheme means 59.5 litres per person per day instead of 70, which is liveable. A 15 per cent drop in Chaitra on an irrigation scheme is not the same thing at all.
Make that call deliberately and write it into the report. An unacknowledged shortfall becomes a complaint in year two.
Where sizing goes wrong in practice
- Seasonal head variation was never measured. A spring measured in Bhadra tells you nothing about Chaitra, and Chaitra is the design case.
- The command area is larger than the source can sustain. No amount of array fixes a well that gives four cubic metres an hour.
- Peak efficiency was used instead of duty point efficiency, so the array is undersized by 20 per cent from the first line of the spreadsheet.
- Delivery pressure for sprinklers was left out of the head calculation.
- Nobody iterated the pipe. The transmission main matched the pump outlet because that was the path of least resistance in the design office, not in the pipe.
Frequently asked questions
What size solar pump do I need for one hectare?
For paddy, roughly a 1.1 kW pump with a 1.4 kWp array at 10 m total dynamic head, or 3 kW with 3.9 kWp at 30 m, assuming four peak sun hours and 60 per cent duty point efficiency. Vegetables need considerably less. Confirm against your own head measurement before buying anything.
How do I calculate total dynamic head?
Add vertical head, drawdown during pumping, friction loss along the pipe, losses through fittings, and any delivery pressure the irrigation method needs. Write each term separately. Friction depends on pipe diameter, so it’s an iteration and not a single calculation.
Do solar water pumps need batteries?
No. A standard system runs only in daylight and stores water in a tank instead of storing electricity. Batteries add substantial cost and need replacing years before the rest of the system does.
How many peak sun hours should I use for Nepal?
Four, for a fixed tilt off grid system that has to perform through winter. Take the minimum monthly average from your irradiation dataset rather than the annual figure, and apply the dataset’s own uncertainty margin on top.
Can a solar pump run in the monsoon?
It runs, at reduced output on overcast days. That’s rarely a problem for irrigation, since monsoon demand is close to zero anyway. It’s a real problem for drinking water schemes, which is why those get storage tanks sized for two days of autonomy.
Where to go next
Work the chain in order and write down every term. If a supplier hands you a system size without showing the head build up, the duty point efficiency and the irradiation figure they used, they’ve guessed, and the three numbers you need to check their guess take an afternoon to produce yourself.